")
2024 Las Vegas Average Running Position: In the latest NASCAR Cup Series race at Las Vegas Motor Speedway, the average running positions of top drivers have revealed some truly surprising statistics. As the dust settles on the Las Vegas 400, the rankings paint a vivid picture of performance on the track.
The data exposes unexpected trends and showcases standout performers who defied expectations. These revelations are not just numbers; they hint at deeper strategies, unforeseen challenges, and perhaps even underdog victories waiting to be dissected.
The story behind these average running positions is more than just a list—it’s a narrative of skill, resilience, and the unpredictable nature of motorsports.
Overview of Las Vegas NASCAR Cup Series Race
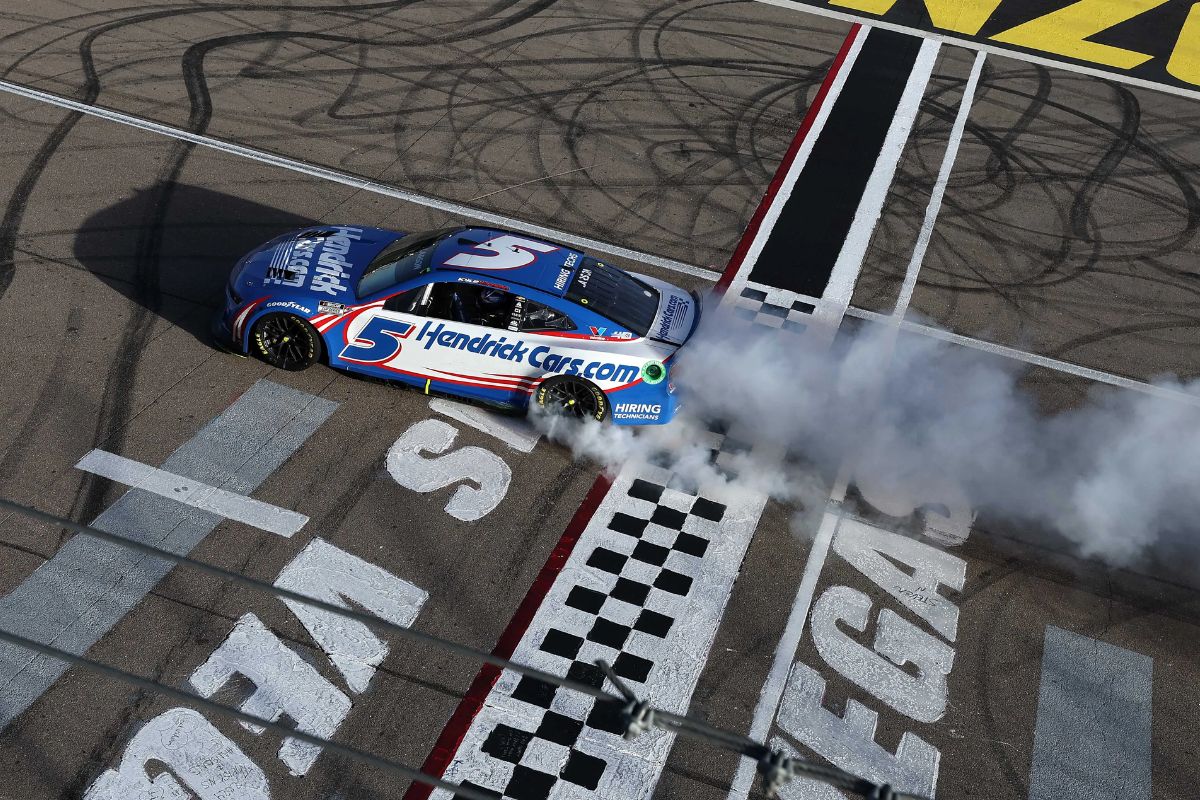
The Las Vegas NASCAR Cup Series race at the recent Pennzoil 400 at Las Vegas Motor Speedway showcased Kyle Larson’s exceptional performance, solidifying Chevrolet’s impressive start in the 2024 season. Larson’s dominance was evident as he secured his third career win at the track with a commanding Average Running Position of 1.67 throughout the 267-lap race. This stellar performance placed him well ahead of his competitors, highlighting Chevrolet’s prowess on the track this season.
While Larson shone brightly, other notable drivers also made their mark. Martin Truex Jr. claimed the second-best Average Running Position at 5.25, securing a commendable seventh-place finish. Tyler Reddick followed closely, finishing as the runner-up with an Average Running Position of 5.61.
Despite the strong showing from the top finishers, Ross Chastain faced challenges during the race, resulting in the worst Average Running Position at 16.46. Pit road penalties and race-day mistakes contributed to his struggles. Overall, the Las Vegas race provided an exciting display of skill and strategy among the top drivers in the NASCAR Cup Series.
Las Vegas 400 Average Running Position Rankings
Revealing the rankings for Average Running Position at the Las Vegas 400 sheds light on the impressive performances of each driver during the race. Kyle Larson showcased exceptional dominance, securing a Finish Position of 1 with an outstanding Average Position of 1.67.
| Pos | Driver | Finish Pos. | Average Pos |
|---|---|---|---|
| 1 | Kyle Larson | 1 | 1.67 |
| 2 | Martin Truex Jr | 7 | 5.25 |
| 3 | Tyler Reddick | 2 | 5.61 |
| 4 | Denny Hamlin | 8 | 7.07 |
| 5 | Ty Gibbs | 5 | 8.42 |
| 6 | Ryan Blaney | 3 | 8.57 |
| 7 | Joey Logano | 9 | 10.52 |
| 8 | Kyle Busch | 26 | 12.01 |
| 9 | Chase Elliott | 12 | 12.07 |
| 10 | Corey LaJoie | 32 | 13.04 |
| 11 | Daniel Suarez | 11 | 14.57 |
| 12 | Chase Briscoe | 21 | 14.57 |
| 13 | Alex Bowman | 18 | 15.26 |
| 14 | Austin Dillon | 16 | 15.34 |
| 15 | Carson Hocevar | 15 | 15.41 |
| 16 | Ross Chastain | 4 | 16.46 |
| 17 | Noah Gragson | 6 | 16.88 |
| 18 | William Byron | 10 | 17.71 |
| 19 | Austin Cindric | 29 | 20.42 |
| 20 | Michael McDowell | 25 | 21.31 |
| 21 | Ricky Stenhouse Jr | 17 | 21.61 |
| 22 | Erik Jones | 14 | 21.68 |
| 23 | Brad Keselowski | 13 | 21.91 |
| 24 | John H. Nemechek | 22 | 22.26 |
| 25 | Christopher Bell | 33 | 22.46 |
| 26 | Josh Berry | 20 | 22.63 |
| 27 | Harrison Burton | 30 | 23.90 |
| 28 | Todd Gilliland | 24 | 24.70 |
| 29 | Ryan Preece | 23 | 25.71 |
| 30 | Bubba Wallace | 35 | 25.72 |
| 31 | Daniel Hemric | 19 | 27.85 |
| 32 | Derek Kraus | 28 | 28.38 |
| 33 | Justin Haley | 27 | 28.44 |
| 34 | Kaz Grala | 31 | 29.47 |
| 35 | Chris Buescher | 37 | 33.98 |
| 36 | JJ Yeley | 34 | 34.31 |
| 37 | Zane Smith | 36 | 35.84 |
These figures offer a detailed insight into each driver’s consistency and competitiveness on the track, illustrating the strategic maneuvers and skillful driving that unfolded during the Las Vegas 400.
